
Before
The spreadsheet chaos
A long spreadsheet of quality issues leads to "squeaky wheel" priorities, low-impact projects and no way to prove ROI.
A quality prioritization matrix, or QA Matrix, ranks your defects so you fix the costly ones first. LeanSuite gives every internal and customer defect an AA, A, B or C priority and turns the top ones into Kaizen or CAPA projects.
By clicking "Schedule Demo," you agree to the use of your data in accordance with LeanSuite's Privacy Notice, including for marketing purposes.
TRUSTED BY INNOVATIVE LEADERS
QA matrix, worked example
A QA matrix (quality assurance matrix) lists defect modes down the side and the process stations across the top in flow order. Each row marks where the defect is made (M) and where it is first caught (C), and rates it for severity, occurrence and detection, so checks and error-proofing go to the stations where defects start. There is no single standard format: each plant sets its own scales.
| Defect mode | Made at | First caught at | Severity (weight) | Occurrence | Detection | Score | Class |
|---|---|---|---|---|---|---|---|
| Screw under-torqued | Screw fastening | Not caught: reaches the customer | 5 (10) | 2 | 5 | 100 | AA |
| Insert not fully seated | Insert press | Function test, 3 stations later | 4 (7) | 3 | 3 | 63 | A |
| Sink mark on the visible face | Molding | Final inspection, 6 stations later | 2 (2) | 4 | 4 | 32 | B |
| Missing screw | Screw fastening | The same station | 4 (7) | 2 | 1 | 14 | C |
Illustrative numbers from the worked example in the free QA matrix template. Score = severity weight × occurrence × detection; detection runs from 1 (caught where it is made) to 5 (not caught before the customer). Class limits used there: AA 100 or more, A 50 to 99, B 20 to 49, C under 20. They are a starting point made for the template, not a standard.
Read it from the top. The under-torqued screw ranks first because no station catches it. A torque check at screw fastening catches it where it is made, so detection falls from 5 to 1 and the score from 100 to 20. The missing screw already scores low because it is caught at the station that makes it, which is the pattern every row should end up with. The full example, with eight defect modes, the rating scales and a Pareto of the scores, is in the QA matrix template.
LeanSuite does the same ranking from imported defect data: each defect gets an AA, A, B or C class from cost, frequency, severity and detection point, with weights you set, and any defect can open a Kaizen or CAPA.
Lean AI
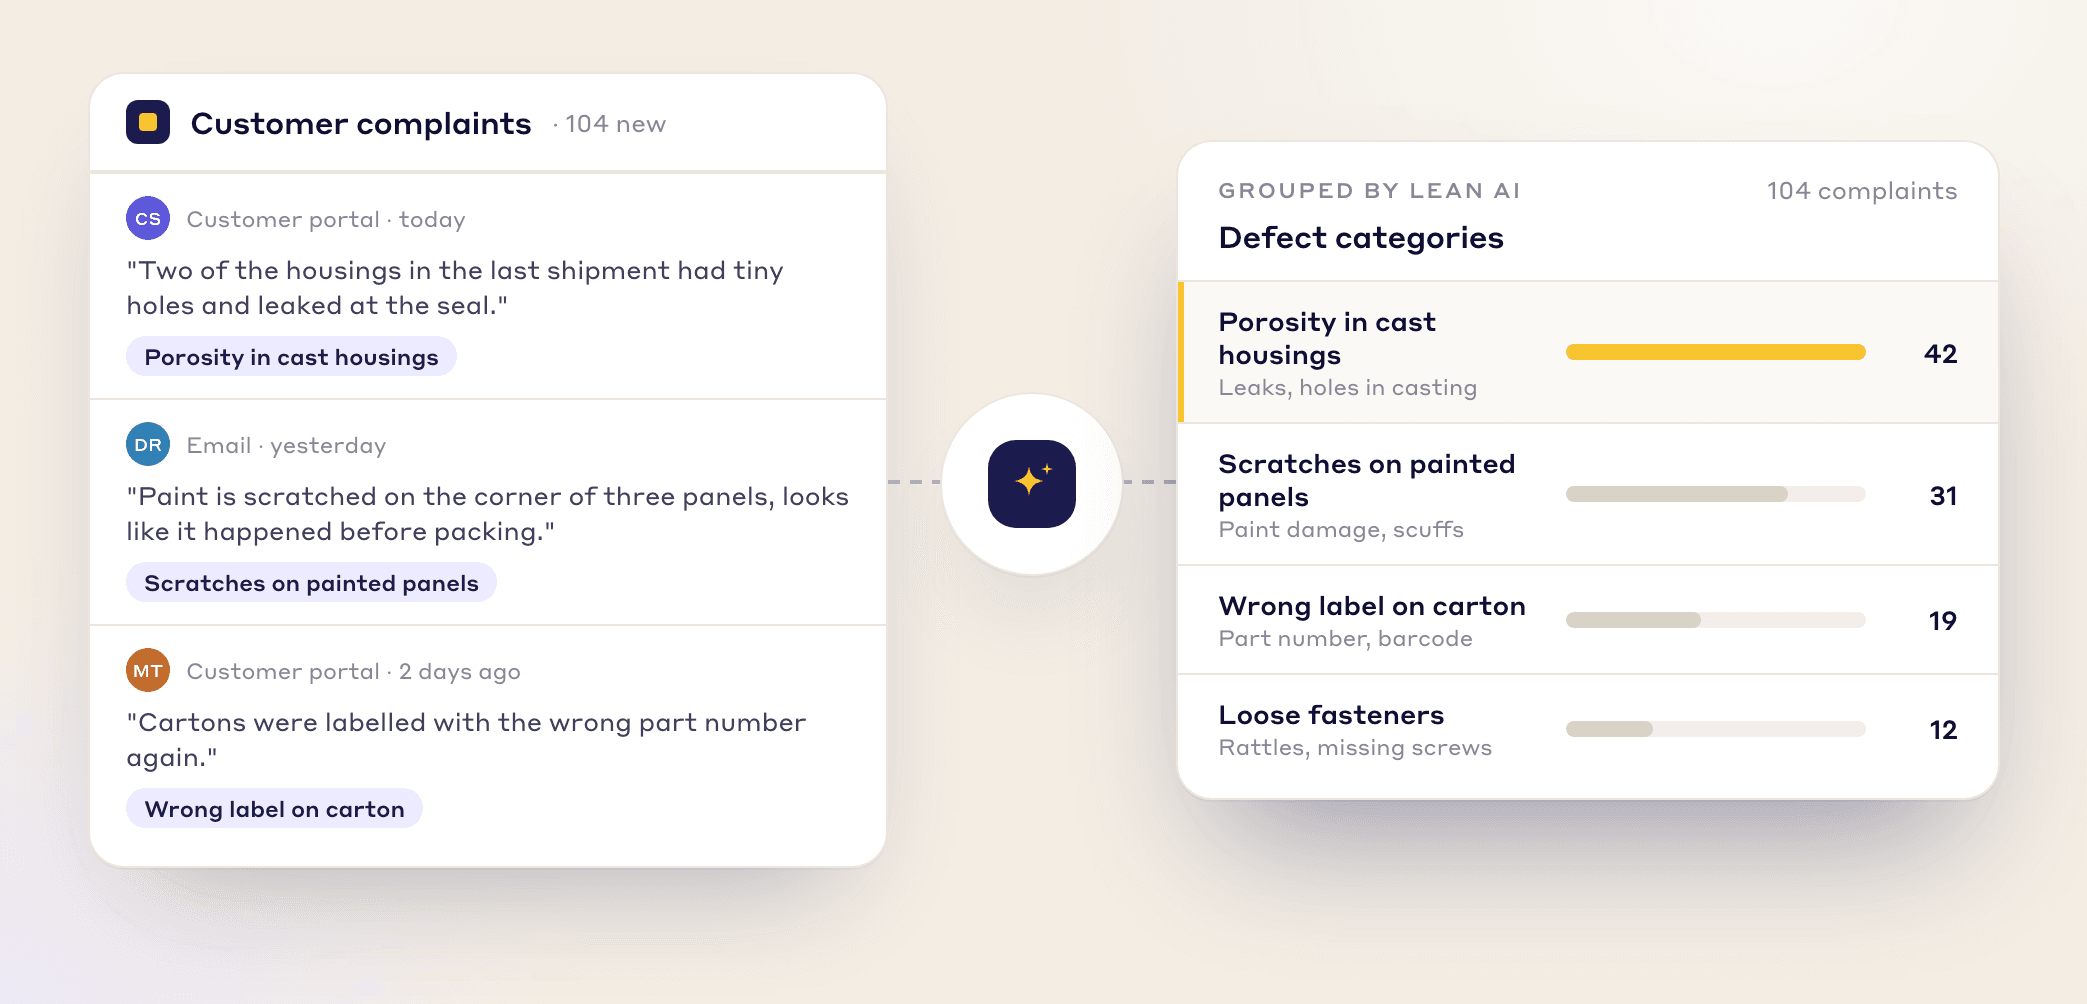
Stop reading and sorting customer feedback by hand. Lean AI reads free-text complaints and groups them into standard defect categories you can count and act on.
BEFORE AND AFTER
The spreadsheet chaos
A long spreadsheet of quality issues leads to "squeaky wheel" priorities, low-impact projects and no way to prove ROI.
The LeanSuite solution
The QA Matrix pulls your defect data into one place and ranks it, so your team works where it matters most.
key benefits
It ties each problem to what it costs your plant and your customers.
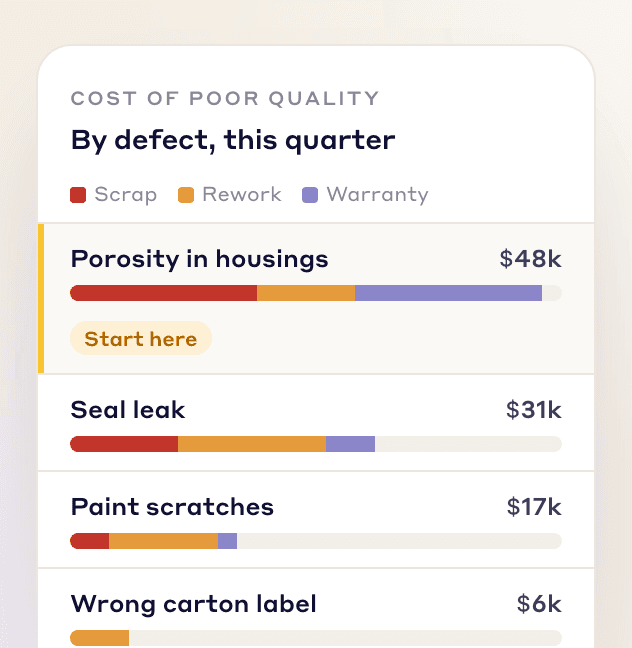
Work on the highest-impact issues first and bring down scrap, rework and warranty costs.
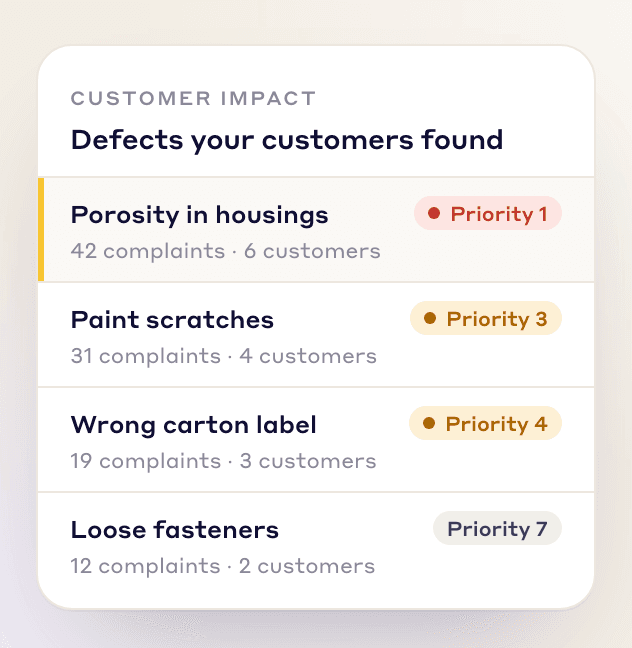
Defects that reach the customer rank higher, so they get fixed first.

Show leadership a cost-backed plan for where the quality team spends its time.
HOW IT WORKS
From scattered defect data to a focused improvement plan.
Import customer complaints, internal non-conformance reports (NCRs) and data from other quality systems, mapping the columns once. Defects are grouped by product category and group.
Each defect gets a priority index of AA, A, B or C from where it was caught, how severe it is, what it costs and how often it recurs.
Analyze causes with 4M1D, then turn a top defect into a Kaizen or CAPA project in one click, with the defect data filled in.
UNDER THE HOOD
Where the matrix gets its data, and how it ranks your defects.
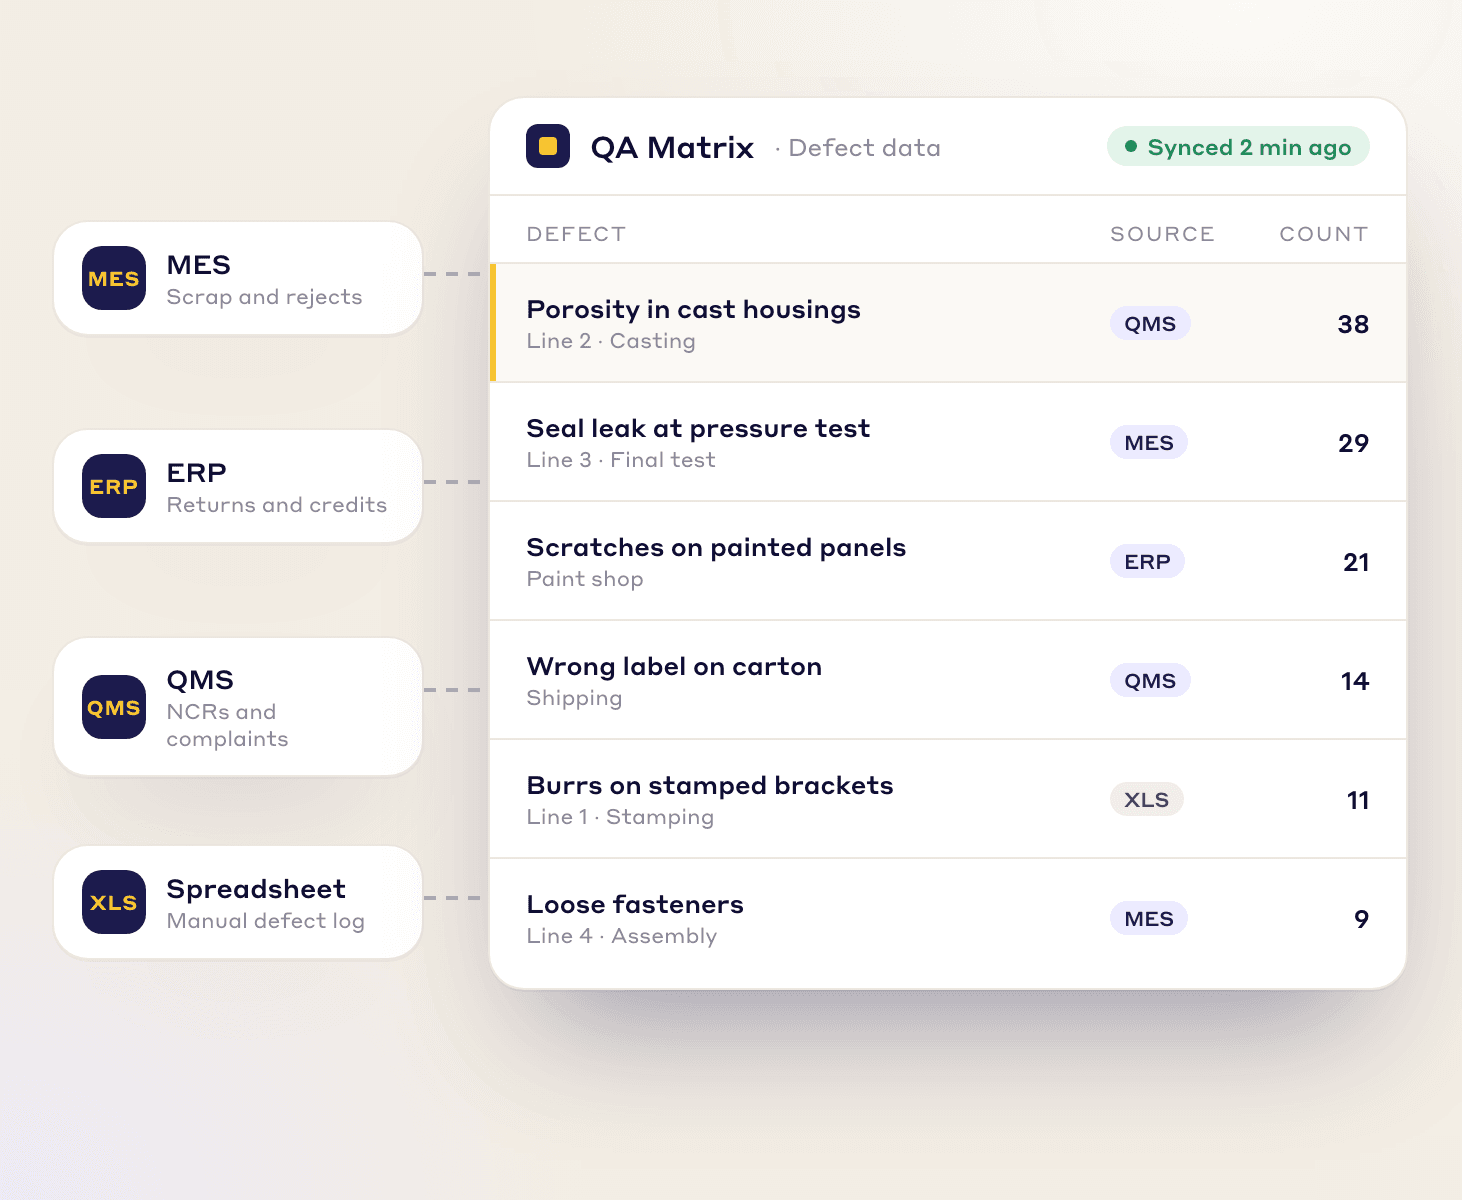
DATA INFLOW
The matrix is only as good as its data, so all your quality data goes into one place.
→ Upload customer complaints, internal NCRs and other defect logs from Excel or CSV and map the columns once.
→ A link to another system, such as an ERP or a customer portal, is set up case by case.
See how it works: What is the QA Matrix?
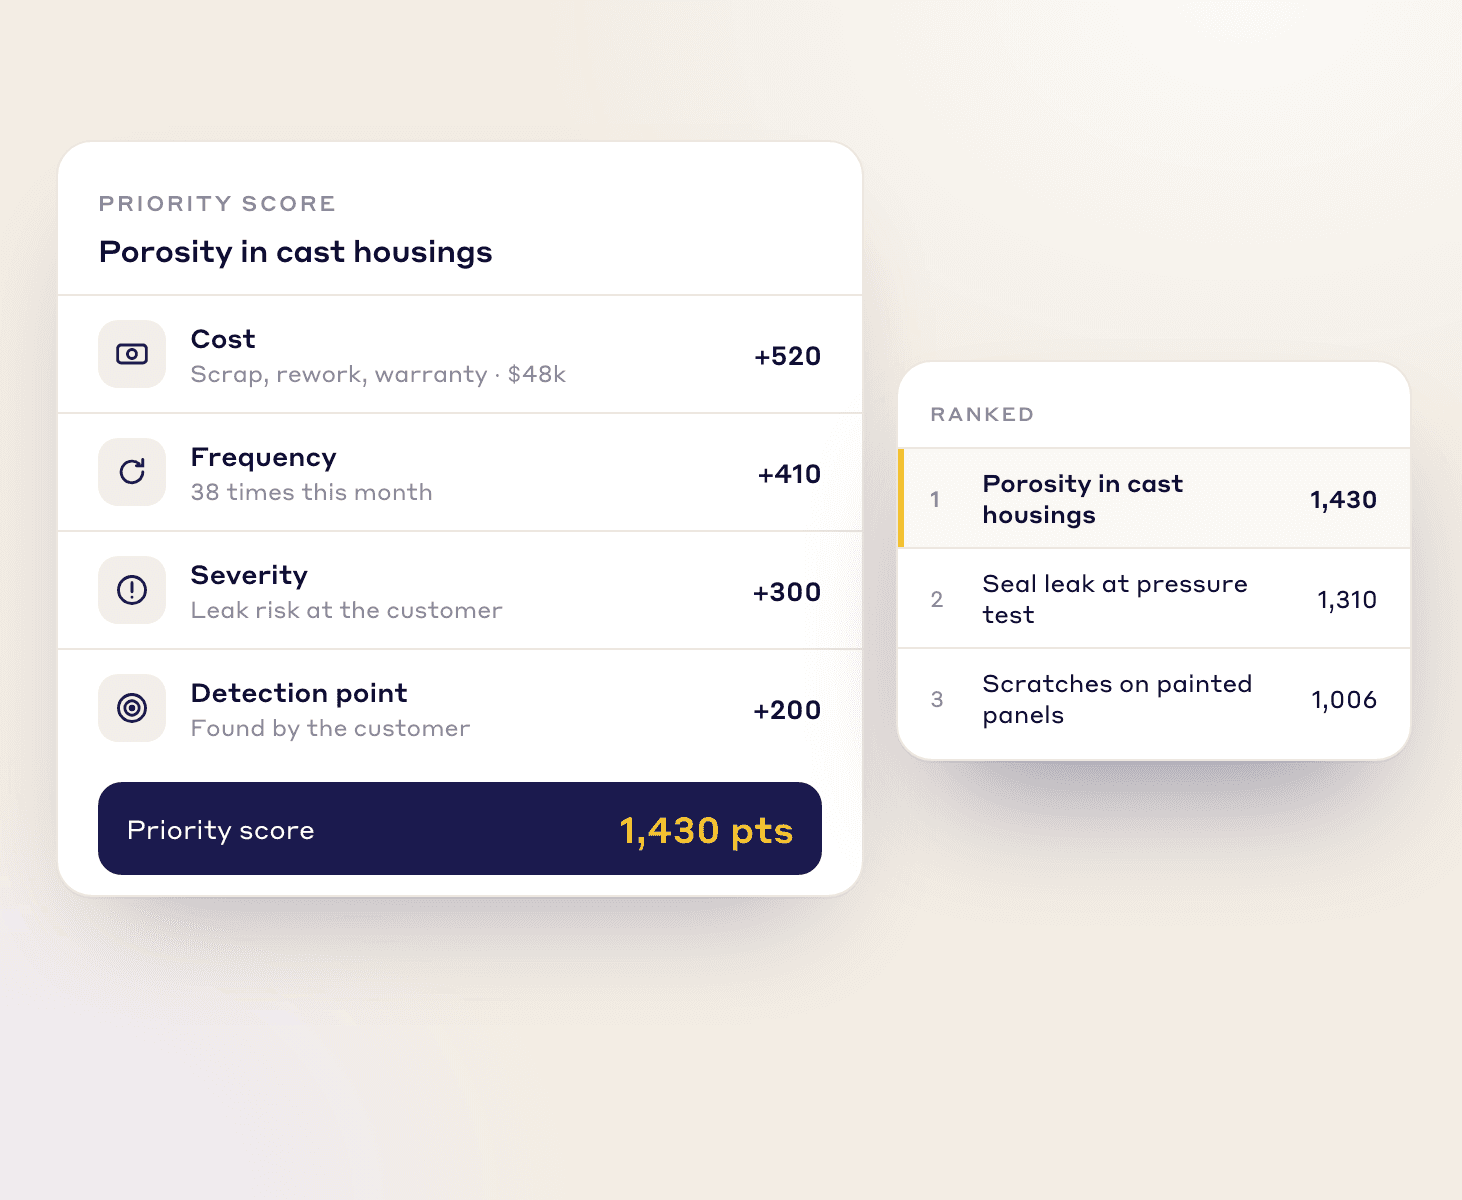
Prioritization logic
Every defect gets a priority index from four factors, and the index sorts it into class AA, A, B or C.
The total cost of the defect, including repairs, scrap, and labor.
How often this specific defect occurs.
The potential impact of the defect (e.g., safety risk, line stoppage).
Where the defect was caught, from the line itself to the customer. The later it is found, the more it costs.
FAQs
A prioritization matrix scores problems against a few weighted criteria, such as frequency, severity and cost, so you work on the most important first. LeanSuite scores each defect this way and sorts it into a priority class.
A QA (quality assurance) matrix links each defect to where it is created and where it is caught, with a severity rating, so a plant sees which steps need stronger controls. It is common in TPM and World Class Manufacturing, and LeanSuite builds it from your defect data.
You import defect data and map its columns once. Each defect is grouped by product category and group and gets an AA, A, B or C priority, and you can analyze its causes with 4M1D and open a Kaizen or CAPA from it.
From cost, frequency, severity and detection point (from the line to the customer). The index sorts each defect into class AA, A, B or C, and you can change the weighting of each factor.
Customer complaints, internal NCRs and other defect records. Upload them from Excel or CSV with a one-time column mapping. A link to another system, such as an ERP or a customer portal, is set up case by case.
Yes. One matrix can cover several facilities, and permissions decide who can change its categories, severities and detection points.
Any prioritized defect becomes a Kaizen, A3, DMAIC or CAPA project in one click, with an auditable link from the original data to the solution.
A spreadsheet matrix is rebuilt by hand whenever new defects come in, and each plant ends up with its own version. In LeanSuite each defect is classed from the data you import, one matrix can cover several plants, and a Kaizen or CAPA opens from any defect with a link back to it.
FREE RESOURCES
Not ready for software yet? Start with these free resources.
See how LeanSuite's Quality Prioritization Matrix ranks your quality issues by cost and impact, and turns the top ones into projects.