
You work the loudest box
When the times are remembered, the step that felt slowest wins the workshop. You spend the quarter improving a box that was never holding the line.
Maps drawn from memory
Your current state value stream map was drawn in a conference room from what people remembered, and the process moved on before the marker was capped. Film each step instead, and let the times come off the video.
By clicking "Schedule Demo," you agree to the use of your data in accordance with LeanSuite's Privacy Notice, including for marketing purposes.
TRUSTED BY INNOVATIVE LEADERS

















Two runs, same map
Same four steps, same plant, same week. One never gets past collecting times; the other comes back from the floor complete.
When the times are remembered, the step that felt slowest wins the workshop. You spend the quarter improving a box that was never holding the line.
Cycle, changeover and uptime come off the footage, and the lead time and inventory between steps come with them. When a step changes, you re-shoot that step instead of booking another workshop.
Sound familiar?
You are about to run another workshop on top of a map you already know is fiction. The boxes hold what people remembered on the day, and the cycle times were estimates even then. A step got rebalanced since, a buffer moved, and the wall never caught up. So the room argues about which number is closest instead of which step to fix.
Drawn from memory
The boxes say what the people in the room recalled, not what the line ran that week.
Times that were guessed
Cycle and lead times are estimates, so the bottleneck you pick may not be the one holding you back.
Stale before it's posted
The process changed while the map was being drawn, and nobody goes back to redraw it.
Times taken from footage
Once it gets uploaded, it analyzes the video. So it could actually help you do the time study fairly quickly and build a Yamazumi chart for you.
One stitched current state
Filmed steps become boxes joined into a current state map with lead times and inventory between them.
Updated by re-shooting
When one step changes, you re-shoot that step rather than redrawing the whole map.
Before the software
Everyone leaves with a map and real energy. The numbers in the boxes came from the room, so the map is only as good as the memories in it.
Someone walks the line with a clipboard for a week. You end up with a handful of cycles per step, taken on the days that person happened to be standing there.
The drawing gets tidier and easier to share around. It still repeats what the last workshop said, because nobody re-measures the steps before redrawing them.
How it works
You walk the process once with a camera instead of filling a whiteboard from memory. Each filmed step becomes a box with real numbers, and the boxes are stitched into a map you can edit, export and branch.
Step 1
One short video per process step, shot by whoever is closest to it. The same footage also serves as the time study.
Step 2
The process box, it's going to be for that one operation, and the same thing for multiple operations. It breaks it down into these three categories, which is value added, semi value added and non value added.
Step 3
The boxes are joined into a current state map with lead times and inventory between steps. Several product families can sit on one map, each with its own routing.
Step 4
There's a template for value stream map and you can make edits to it. Once you've actually built different shapes, you can even group them and build your own templates as well for future use. Let's say you've built the current state and future state and you've mapped that out. It's an ongoing process, and once you hit one bottleneck, you basically go to the next one and see opportunity. It keeps moving.
If nothing changes
It is printed, taped to the wall, and the improvement list is built straight off it.
A line gets rebalanced or a buffer moves, and nothing on the wall changes with it.
Anyone who works the area knows the numbers are off, so the map stops being used to argue anything.
Another workshop is booked, from memory again, and the same cycle starts over.

From our co-founder
“If you built the current state and future state and mapped that out, it's an ongoing process: once you hit one bottleneck, you go to the next one and see opportunity.”
Where next
Each of these starts from what the floor actually did, not what the room recalled on workshop day. Use them to put real times and real steps behind the boxes on the wall.
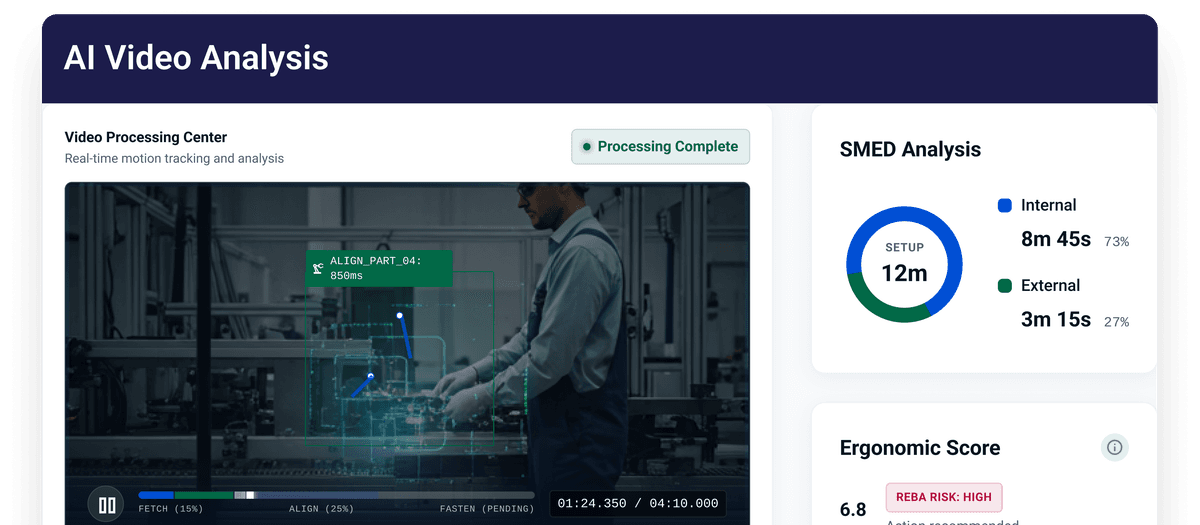
Upload a video of the step and get a summary, the issues it spots, and a performance read instead of relying on what people remember. It cuts the hours of manual review that keep the wall from catching up.
See how it works →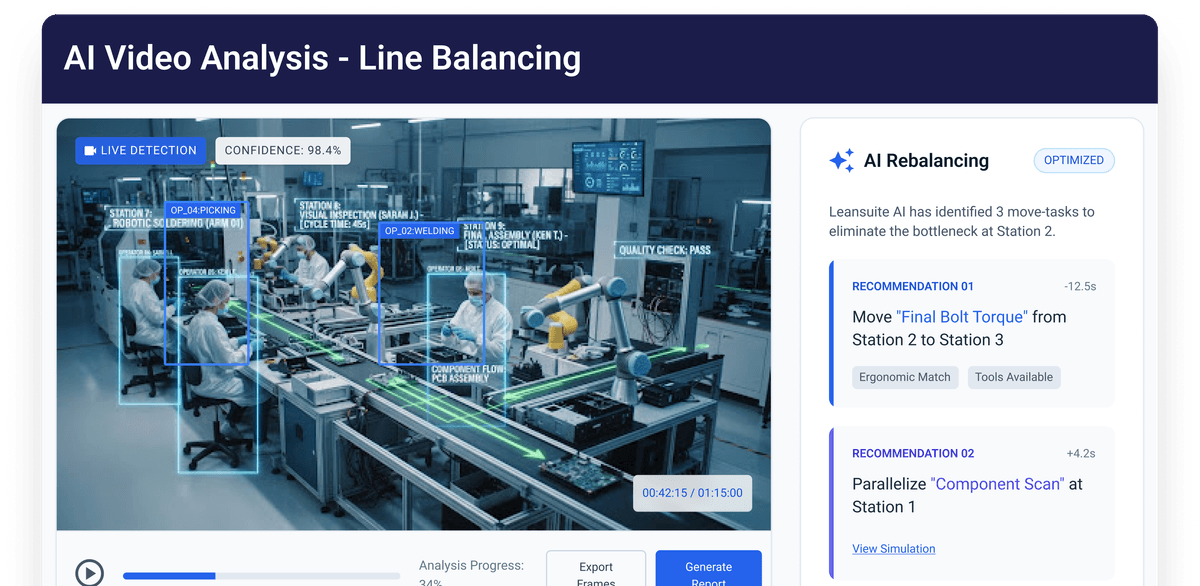
Upload a process video and the cycle times come out of it, so the bar chart is built from the run instead of estimates. You can see where the bottleneck sits and simulate a rebalance before anyone moves anything.
See how it works →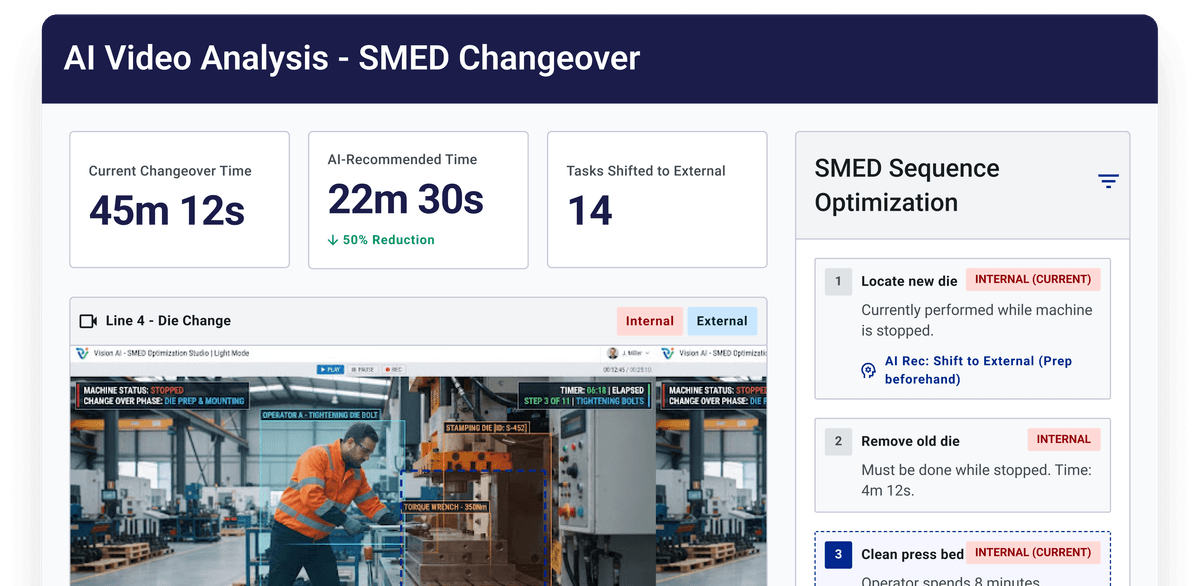
If the argument keeps landing on changeover time, this covers it with visual checklists and alerts when a tool is missing. It is a structured workflow for the changeover itself rather than another line on the map.
See how it works →Show us one process on your floor and we will walk through how it would be filmed, boxed and stitched into a current state map you can edit.