
Resources / Blog
Lean manufacturing blog
313 articles on lean manufacturing and continuous improvement, newest first.
Articles 1 to 50 of 313
- Lean Manufacturing Education

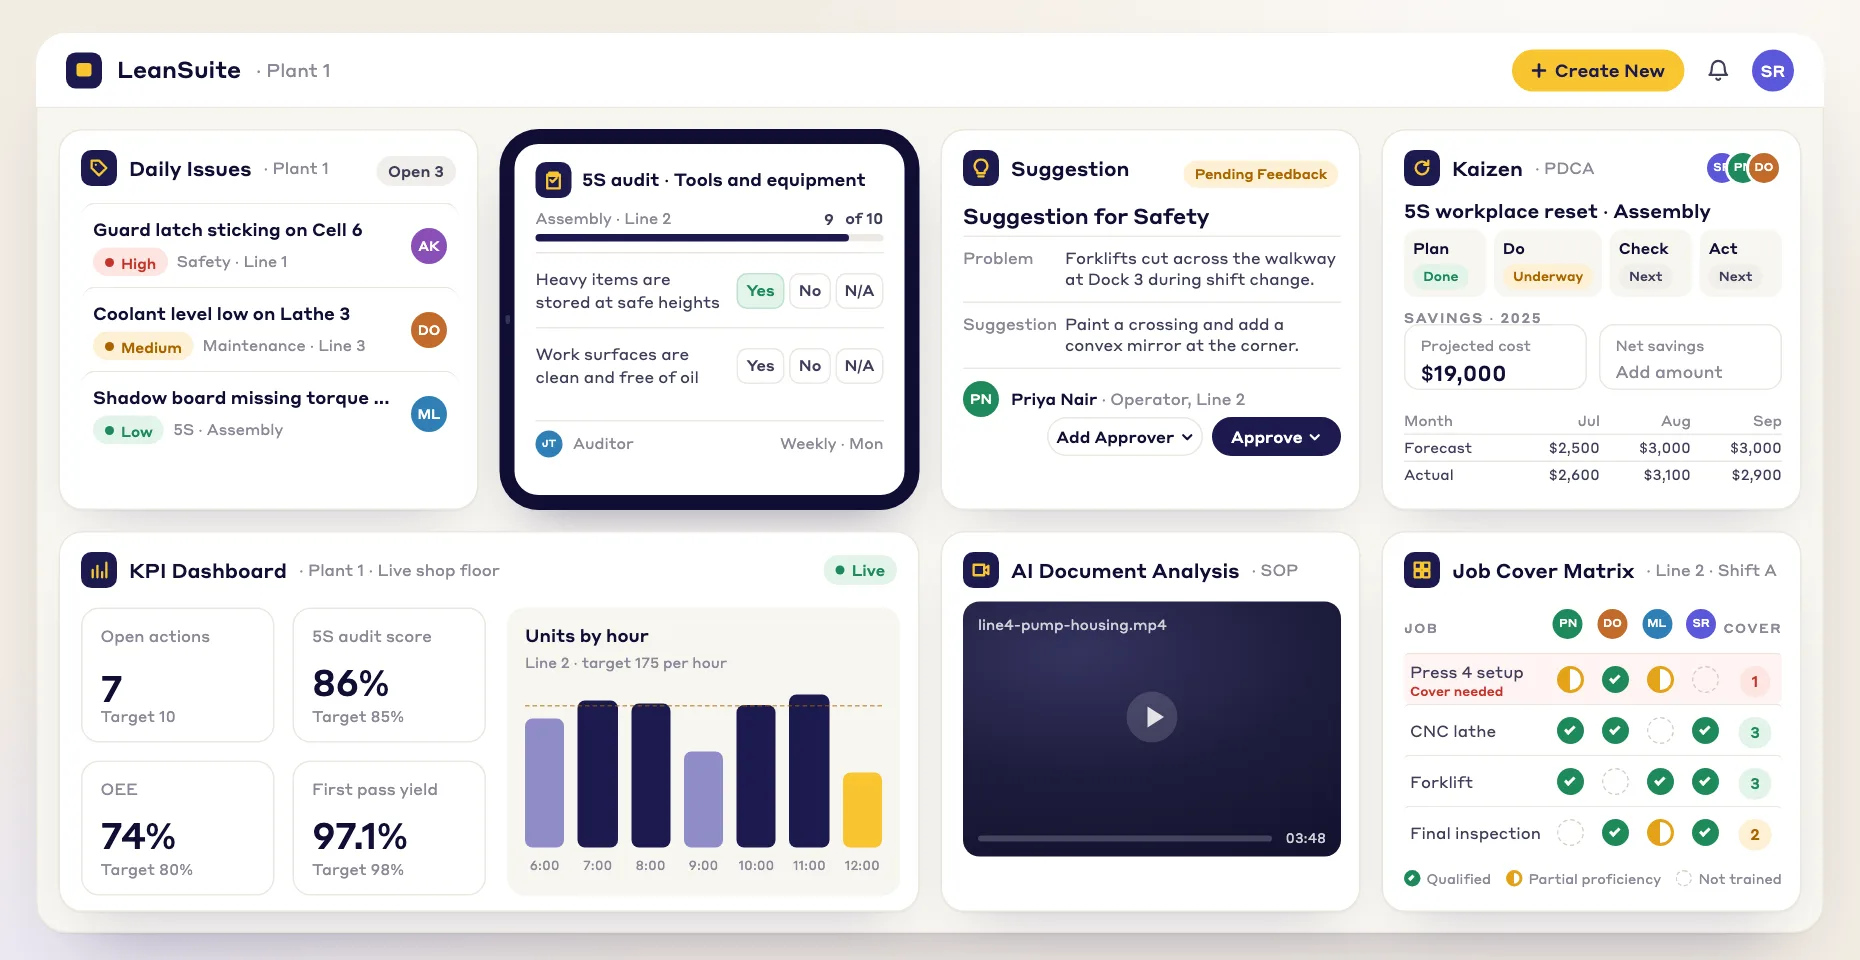
Job Coverage Matrix: Ensuring Operational Continuity
A job coverage matrix lists each critical job against the people qualified to cover it on each shift, so an absence does not stop production. This guide covers building and reading it, setting a coverage rule, a worked example, and daily use.
November 15, 2026
- Lean Manufacturing Education

Skills Matrix: Workforce Capability Mapping in Manufacturing
A skills matrix maps the people in a work area against the tasks it requires, showing who can do what and where coverage is thin. This guide covers building the matrix, defining skill levels, reading gaps, a worked example, and keeping it current.
November 14, 2026
- Lean Manufacturing Education

Training Within Industry: The Three J Programs Explained
Training Within Industry is the wartime set of programs that taught supervisors to instruct workers, improve methods, and handle people problems. This guide covers its origin, the three J programs, and what the sources show about Toyota.
November 13, 2026
- Lean Tools and Methods

Floor Marking and Color Coding: A Manufacturing Guide
Floor marking uses lines, outlines, labels, and colors to show where traffic moves, where material belongs, and where hazards sit. This guide covers what to mark, how to choose a color code, what OSHA and ANSI do and do not say, and a worked example.
November 12, 2026
- Lean Manufacturing Education

TOC in Job Shop Manufacturing: Managing Constraint-Based Scheduling for Custom Production
TOC in job shop manufacturing applies constraint-based scheduling to plants that build varied, custom orders on shared machines. This guide explains finding the constraint, scheduling it, buffering orders, and a worked quoting and release example.
November 11, 2026
- Lean Manufacturing Education

Applying Theory of Constraints in Manufacturing: Step-by-Step Implementation Guide
Applying theory of constraints in manufacturing follows five steps: identify, exploit, subordinate, elevate, and repeat. This guide covers preparation, each step in practice, a worked 12-week rollout, and the pitfalls that published reviews report.
November 10, 2026
- Lean Manufacturing Education

Theory of Constraints vs Six Sigma: Problem-Solving Focus Compared
Theory of constraints vs six sigma compares a method that finds the factor limiting output with one that reduces variation in a process. This guide explains steps, measures, project selection, and a worked scrap example.
November 9, 2026
- Lean Manufacturing Education

Theory of Constraints vs Lean Manufacturing: Differences and Integration
Theory of constraints vs lean manufacturing compares two profit-focused methods with different starting questions, measures, and flow controls. This guide explains where they differ, a worked example of each, and how a plant can combine them.
November 8, 2026
- Lean Manufacturing Education

Throughput Accounting: The Theory of Constraints Financial Model for Manufacturing
Throughput accounting is the theory of constraints financial model that values a plant by the money flowing through its constraint, not unit costs. This guide explains the three measures, return per factory hour, and a worked product mix example.
November 7, 2026
- Lean Manufacturing Education

Buffer Management in Theory of Constraints: Protecting Throughput From Disruption
Buffer management in theory of constraints sizes the protective buffer ahead of the constraint and reads its consumption as an early warning. This guide explains sizing, the green, yellow, and red zones, and a worked example with numbers.
November 6, 2026
- Lean Manufacturing Education

Drum Buffer Rope in Manufacturing: Synchronizing Production to the Constraint
Drum buffer rope in manufacturing synchronizes a plant to its constraint with one schedule, one release rule, and one protective buffer. This guide explains each element, how they work together, and a worked example with numbers.
November 5, 2026
- Lean Manufacturing Education

Manufacturing Bottlenecks: How to Identify the Constraint Limiting Your Throughput
Manufacturing bottlenecks are the resources whose capacity falls below demand, and the one that limits the whole plant sets its output. This guide shows how to identify the constraint with load calculations, queue observation, and utilization data.
November 4, 2026
- Lean Manufacturing Education

The Five Focusing Steps of Theory of Constraints: A Manufacturing Guide
The five focusing steps of theory of constraints give a plant a repeating, cost-ordered sequence for raising output at its limiting resource. This guide explains each step, the tactics behind it, and a worked example showing how the constraint moves.
November 3, 2026
- Lean Manufacturing Education

Theory of Constraints in Manufacturing: A Complete Guide
The theory of constraints in manufacturing focuses improvement on the single resource that limits a plant's output. This guide explains the five focusing steps, the main tools, and how the method fits beside lean and Six Sigma.
November 2, 2026
- Lean Manufacturing Education

Improving OEE: Systematic Loss Reduction Methodology
Improving OEE means reducing specific losses rather than chasing a score, through a repeating cycle of measuring, ranking, fixing, and re-measuring. Learn the five-stage cycle, how to prioritize losses, and a worked packaging line example.
November 1, 2026
- Lean Manufacturing Education

OEE Calculation: Step-by-Step Guide for Manufacturing Teams
An OEE calculation multiplies availability, performance, and quality, each derived from five shift inputs. Learn the five steps, a worked example from raw shift data, and the weighting method for combining shifts or machines.
October 31, 2026
- Lean Manufacturing Education

OEE Benchmarks: What's a Good Score in Manufacturing
A good OEE score depends on equipment, process, and starting point, and the widely cited 85 percent world-class figure is a ceiling rather than a target. Learn what typical scores look like and how to set a realistic benchmark.
October 30, 2026
- Lean Manufacturing Education

Manufacturing Throughput: Measuring and Optimizing Production Flow Rate
Manufacturing throughput is the rate at which a line produces good output, and it is set by the slowest station rather than the fastest machine. Learn the formula, how bottlenecks limit it, and how to raise it without wasted effort.
October 29, 2026
- Lean Manufacturing Education

TEEP in Manufacturing: Total Effective Equipment Performance Explained
TEEP measures how much of a machine's total calendar time produces good output at full speed, not just the time it was scheduled to run. Learn the formula, how TEEP differs from OEE, and when to use it for capacity decisions.
October 28, 2026
- Lean Manufacturing Education

OEE Components: Availability, Performance, and Quality Explained
OEE breaks into three components, availability, performance, and quality, each measured as its own ratio before the three are multiplied into one score. Learn what each component counts, how its formula works, and where the data comes from.
October 27, 2026
- Lean Manufacturing Education

The Six Big Losses That Reduce OEE in Manufacturing
The six big losses sort every cause of lost equipment effectiveness into categories under availability, performance, and quality. Learn what each loss covers and how to classify downtime, slow running, and scrap correctly.
October 26, 2026
- Lean Manufacturing Education

Overall Equipment Effectiveness: A Complete Manufacturing Guide
OEE combines availability, performance, and quality into one score that shows how much of a machine's true production potential is actually being used. Learn what it measures and why it matters.
October 25, 2026
- Lean Manufacturing Education

SMED Implementation: Step-by-Step Changeover Reduction for JIT
Rolling out SMED across a plant is a fixed sequence of steps, not a single event. Learn the implementation process from selecting a machine through sustaining the gains.
October 24, 2026
- Lean Manufacturing Education

Internal vs External Setup in SMED: Changeover Optimization
Making the internal/external setup split work requires more than sorting tasks into two lists. Learn the practical techniques for actually moving work out of the stopped window.
October 23, 2026
- Lean Manufacturing Education

SMED in JIT Manufacturing: Single-Minute Exchange of Die
SMED cuts equipment changeover time down to minutes by separating setup work that needs the machine stopped from work that doesn't. Learn how the method works and what it requires.
October 22, 2026
- Lean Manufacturing Education

Cell Design for JIT Flow: Step-by-Step Layout Planning
Designing a production cell means working through a fixed sequence of decisions in order. Learn the step-by-step process and where most designs go wrong.
October 21, 2026
- Lean Manufacturing Education

Chaku Chaku Cells: Operator-Free Automated Manufacturing
Chaku chaku cells let one operator walk a loop loading machines that unload and advance parts on their own. Learn how the technique works and what it requires.
October 20, 2026
- Lean Manufacturing Education

U-Shaped Cells in Lean Manufacturing: Key Layout Advantages
U-shaped cells bring a cell's entry and exit points next to each other. Learn why this specific shape outperforms a straight-line cell and when it fits.
October 19, 2026
- Lean Manufacturing Education

Cellular Manufacturing in JIT: Benefits and Implementation Guide
Cellular manufacturing groups the equipment needed to complete a product into one compact, process-sequenced area. Learn what it changes, what it costs to convert, and when it pays off.
October 18, 2026
- Lean Manufacturing Education

Continuous Flow Design: Creating Uninterrupted Production in JIT
Continuous flow design combines takt-paced timing, single-unit transfers, and leveled scheduling into one line that moves without interruption. Learn what it draws together and where it deliberately breaks.
October 17, 2026
- Lean Manufacturing Education

Heijunka in JIT: Leveling Production for Mixed Models
Heijunka levels production volume and mix so a line builds a steady, repeating pattern instead of large batches of one model at a time. Learn how leveling works and what it requires.
October 16, 2026
- Lean Manufacturing Education

Cycle Time vs Takt Time: Understanding the Difference
What it means when cycle time runs above or below takt time, how to measure it, and how to compare the two across a multi-station line.
October 15, 2026
- Lean Manufacturing Education

One-Piece Flow in JIT: Eliminating Batch and Queue Production
How one-piece flow differs from batch-and-queue production, what must be in place first, its effect on lead time and inventory, and when it does not fit.
October 14, 2026
- Lean Manufacturing Education

Cycle Time vs Lead Time in Lean Manufacturing: Key Differences
Why lead time is almost always longer than cycle time, what Little's Law says about the gap, and how to measure and shrink it.
October 13, 2026
- Lean Manufacturing Education

Takt Time in JIT: Matching Production to Customer Demand
Takt time is available production time divided by customer demand, the rate at which one unit must be completed to match what customers actually need. Learn how it's calculated and applied.
October 12, 2026
- Lean Manufacturing Education

Pitch in JIT Manufacturing: Timed Production Intervals
Pitch is the standard container quantity multiplied by takt time, the interval at which finished containers should leave a paced process. Learn how pitch is calculated and used to pace production.
October 11, 2026
- Lean Manufacturing Education

FIFO Lanes in Pull Systems: First-In-First-Out Flow Control
A FIFO lane connects two processes with a capped, ordered queue that enforces first-in-first-out flow without a kanban signal. Learn when a FIFO lane fits better than a kanban loop or a supermarket.
October 10, 2026
- Lean Manufacturing Education

Point-of-Use Storage in Pull Systems: Cutting Transport Waste
Point-of-use storage places a small working supply of parts within an operator's reach at the station itself. Learn how it's sized, replenished, and kept separate from a supermarket's larger buffer role.
October 9, 2026
- Lean Manufacturing Education

Kanban Card Types: Production, Withdrawal, Signal, Two-Bin and Electronic
Production, withdrawal, signal, two-bin and electronic kanban: what each does, how the loop works, and how to work out how many cards you need, with worked examples.
October 8, 2026
- Lean Manufacturing Education

Kanban Pull Systems: Visual Scheduling in Manufacturing
Kanban pull systems use visual signals to trigger replenishment only when it's actually consumed, not a forecast. Learn how the signal, the board, and the governing rules work together to schedule production without a push schedule.
October 7, 2026
- Lean Manufacturing Education

Process Capability: Cp and Cpk Explained for Manufacturing
Cp and Cpk are the two numeric measures that answer whether a process is actually capable of consistently meeting specification, not just whether it happened to produce a good part today. Learn how each is calculated, what they mean, and why they aren't the same question.
October 6, 2026
- Lean Manufacturing Education

Control Charts: Reading and Interpreting Manufacturing Data
A practical guide to control charts: the parts of a chart, choosing a type for the data, patterns that signal a shift, and a worked reading example.
October 5, 2026
- Lean Manufacturing Education

Statistical Process Control: Basics for Manufacturing Teams
Statistical process control uses data to distinguish ordinary process variation from a genuine shift worth investigating. Learn the difference between common-cause and special-cause variation, and why that distinction is the foundation for every other Six Sigma tool.
October 4, 2026
- Lean Manufacturing Education

DMAIC in a Plant: Phase Gates, Tools and a Worked Example
What each DMAIC phase gate has to produce, when DMAIC fits and when a smaller method will do, and a worked weld porosity example on a bracket line.
October 3, 2026
- Lean Manufacturing Education

Lean Six Sigma: Combining Methodologies for Maximum Impact
Lean improves speed and flow, Six Sigma reduces variation. How the two combine, when to lean on one more, and the misconceptions that slow adoption.
October 2, 2026
- Lean Manufacturing Education

Auditing Standard Work: Verification and Compliance Checks
Standard work drifts without someone periodically confirming it still matches reality. Learn how formal standard work audits work, how they differ from leader standard work's daily checks, and how to build an audit that actually catches drift.
October 1, 2026
- Lean Manufacturing Education

Work Instructions: Visual and Effective Documentation
What a good work instruction contains, how to format it for the point of use, digital versus paper, and how to keep it current.
September 24, 2026
- Lean Manufacturing Education

Standard Operating Procedures: Creation and Implementation Guide
A standard operating procedure defines the required, approved steps for a regulated or safety-critical activity. Learn how to write, approve, roll out, and maintain an SOP that people actually follow, not just one that satisfies an audit.
September 24, 2026
- Lean Manufacturing Education

TWI Job Instruction: The Training Method Behind Standard Work
A job breakdown sheet does nothing on its own until an operator can perform the job the way it describes. TWI Job Instruction is the four-step method, Prepare, Present, Try Out, Follow Up, that transfers a standard reliably from the sheet to the operator's hands.
September 22, 2026
- Lean Manufacturing Education

Standard Work vs SOPs vs Work Instructions: Key Differences
Standard work, standard operating procedures, and work instructions are often used interchangeably, but each serves a distinct purpose and audience. Learn what separates them, where they overlap, and which document to use for which job.
September 22, 2026
Want our lean manufacturing guides first in Google? Add us as a preferred source.
Add LeanSuite as a preferred source on Google (opens in a new tab)